What Transmission Electron Microscopy (TEM) Magnifications Should I Use?
"Those who cannot remember the past are condemned to repeat it." George Santayana.
One of the first questions that a new user of any sort of microscope asks is usually "What magnifications should I use when collecting images?" This is actually a much more difficult question to answer than one might suppose, and the following lengthy discussion attempts to provide a few things to consider and some guidelines to follow when choosing the magnification for a project.
The most simple answer to this question is that one needs to use a magnification high enough to see what is interesting. However, this answer invokes an additional question of its own: what is interesting for a given project (or perhaps better put, what does one want to learn from the project)? Here are three examples of TEM work where the answers to these questions involve entirely different length scales and result in the use of very different magnifications:
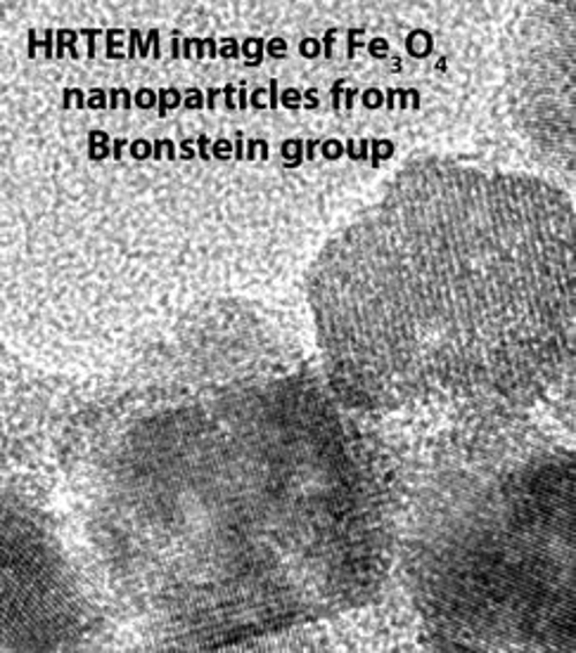
High-resolution transmission electron microscopy (HRTEM) image of Fe3O4 nanoparticles from Bronstein group.
A materials scientist will often want to show both the size and the crystallinity of nano-particles. This will require some images with magnification high enough to see the atomic spacings (2-4 Å) in order to show specimen crystallinity. While the exact magnification will again depend on the spacings one needs to see and how one is recording images, a general rule is that atomic spacings from many crystalline nano-particles are usually best seen in images recorded at magnifications between 100,000x and 500,000x. On the other hand, it is also often necessary to record images at magnifications low enough to show the overall size distribution of a large population of particles. Larger particles will require lower magnifications in order to show multiple particles in a single image and the required magnification for such images can range from 20,000x to 100,000x. As always, specimen properties will dictate at least some of the magnifications used.
A structural biologist might want to show where a specific protein binds to a known biological complex (e.g., where a mono-clonal antibody binds a virus particle or where a protein translation initiation factor binds a ribosome, as shown in the figure here, taken from Agrawal et al.). Such a protein binding project requires a magnification high enough to see the binding protein itself (which will depend on that protein's size) but does not require the atomic resolution necessary to show nano-particle crystallinity. Most binding proteins will be several nanometer (nm) in diameter, and magnifications in the range of 20,000x to 40,000x are usually sufficient for such work. On the other hand, if the goal is to discuss amino acid side-chains at the binding surface, the magnification will need to be high enough to see the atomic structure of the binding interface itself (likely to be on the order of 60,000x to 80,000x) or to model known atomic structures into the reconstruction with atomic accuracy. High resolution modeling of atomic structures into a biological system can require magnifications anywhere from 20,000x to 80,000x (but seldom higher). It is also worth considering that if the only acceptable result is a detailed description of side-chain interactions across the binding surface, TEM may not be the best choice of experimental technique!
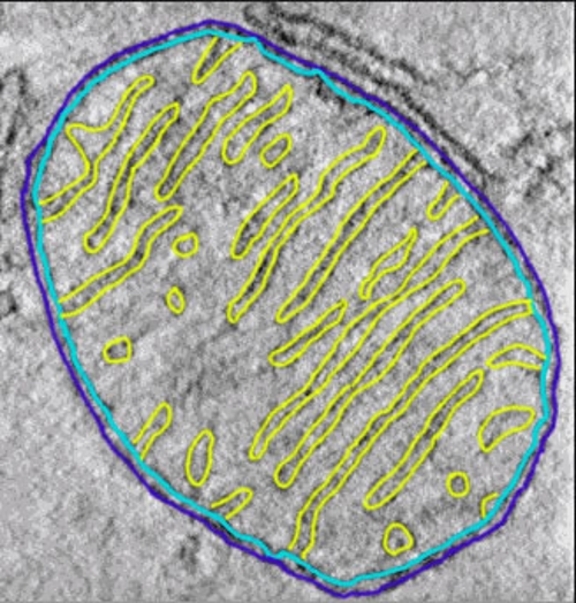
A cell biologist might want to trace the membrane system through an entire organelle (e.g., an intact chloroplast or a mitochondrion) or throughout major portions of any sort of cell. This is a tomography project requiring data in three-dimensions (3d) throughout a large volume, and it would necessitate the use of lower magnifications than the previous projects because of both the large area/volume necessary to image (bacteria and most cellular organelles are usually measured in terms of several micrometers, μm, while macromolecular complexes are measured in 10's or 100's of nm) and the large size of the membrane features of interest. Membranes have a thickness on the order of 3-5 nm, and provided no structural details of the actual membranes are needed, magnifications as low as 2500x to 10,000x may be sufficient. It may also be the case that for a project where the only interest is membrane tracing through large volumes of material, TEM tomography is not the best option, and that one might instead consider doing FIB/SEM 3d structure determination or serial block face SEM work.
An organelle with its membrane system traced with three-dimensional data.
A key aspect in the discussion of these three types of project is that both the sample itself and the goal of the work are important in determining the proper magnification(s) to use. It may also be useful to note that in the discussion above and all that follows, the assumption is made that images will be recorded using some sort of digital camera (i.e., a conventional TEM CCD camera or one of the new, direct electron detectors). If one is, in fact, recording images onto film, then the magnification used will depend not only on what one wants to see/learn, but also the details of the film scanner that will be used to digitize the images.
Additional issues can affect the idea of "magnification high enough to see what is interesting," especially for cryoTEM projects that involve extensive data collection and image processing. The following list highlights several issues to consider when beginning a cryoTEM project, keeping in mind that some of these really relate back to the question of what one wants to see and how one makes certain that experimental details do not interfere with that goal:
Yeast ribosome structure, obtained using a small number of particles and processed using the random conical tilt method.
Has Any Preliminary Work Been Done?
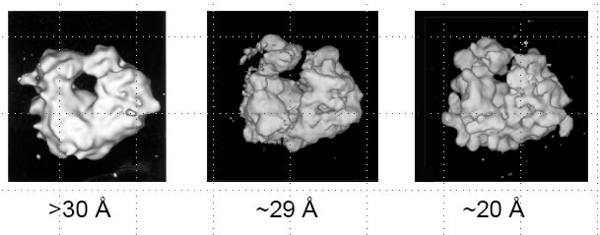
For example, if one needs a high resolution structure of any sort of biological complex but no preliminary work has been done with it, the best approach is likely to be a gradual accumulation of enough information to attain the final high resolution goal. In other words, examine the specimen in negative stain (if possible) to ascertain that it is suitable for further studies. Then examine frozen samples, but collect images designed to produce a relatively modest resolution structure (15-20 Å or even lower) since that is likely to be significantly faster and more satisfying than immediately trying to attain near-atomic resolution images and reconstructions. Finally, when the project is going well and most (or all) issues with the sample have been solved, collect as much high resolution data as possible (making use of any available automated data collection scheme). As an example, the set of images at the right shows a yeast ribosome structure that was initially obtained using a small number of particles and processed using the random conical tilt method and then slowly improved by adding more and more images and processing them using an iterative Radon transform based method.
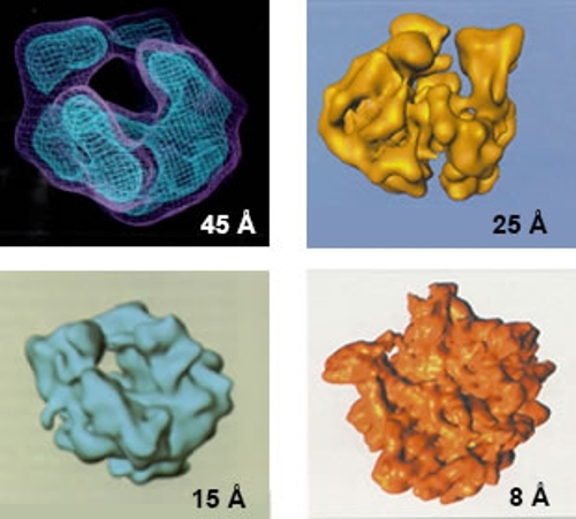
A gallery of E.coli ribosome structures showing the progression of the structure over many years as microscopes and preparation methods have evolved.
If low resolution preliminary work has been done (and especially if the work was done in a different laboratory and/or using different equipment), the best initial approach is likely to be to replicate what was done to obtain the lower resolution structure: confirm that the current specimen itself is well-behaved, that the specimen preparation retains at least the resolution of the previous study and that the data collection scheme is working well enough to repeat what has been done in the past. The figure to the right collects a gallery of E. coli ribosome structures from Joachim Frank and others and shows the progression of the structure over many, many years as microscopes, sample preparation methods and data processing improved, and as the people doing the work developed the expertise necessary to produce the high resolution structure shown in the lower right. It is certainly possible simply to start work geared towards high resolution, but high resolution cryoTEM structures are often not easily attained, and an initial study at lower resolution should both be relative fast and also may save much time, effort and anguish in the long run if it turns out that there are issues with the specimen, its preparation for imaging or the imaging itself.
It is also worthwhile to point out here that even if there is preliminary work at moderate resolution, someone who has never done cryoTEM work should most likely start a project where the goal is high resolution by initially replicating any previous, modest resolution work before attempting to attain high resolution data.
What is Known About How Well-Ordered a Specimen Might Be?
As an example, despite years and years of work with actin filaments of many sorts, there is virtually no evidence that actin filaments have an atomic structure that can be accessed using X-ray fiber diffraction techniques or recovered using cryoTEM approaches. Some actin filaments and complexes of filaments with various actin binding proteins are more ordered than others, but as a general rule, actin filaments are flexible enough to make the assumption of a single atomic structure moot. Accordingly, setting an initial goal of atomic resolution images and reconstructions of certain actin structures may be somewhat foolish, and one should most likely initially collect images aimed at modest resolution (15-20 Å). It may eventually be possible to extract high resolution data from such a sample, but it may also be the case that fitting atomic resolution models into the molecular envelope of a >20 Å reconstruction is sufficient for the goals of a particular project. For example, the figure to the right shows cryoTEM reconstructions of actin alone and actin decorated with fimbrin, a superposition of the two reconstructions and the fitting of atomic models into the molecular envelopes from the EM. The cryoTEM reconstructions are both filtered to 28 Å resolution, but careful fitting followed by the analysis of the binding interface between actin and the fimbrin actin-binding-domain allowed this atomic resolution model to be built from a pair of rather low resolution cryoTEM reconstructions.
The issue of intrinsic specimen order really falls into the category of defining the initial project in a way that is realistic. It may be known from other experimental techniques that a particular sample is (or can be) highly ordered, or it may be known that attempts to show order have failed. It may even be a significant part of the proposed work to show what the potential order can be inside the TEM. For example, the type of two-dimensional (2d) and thin three-dimensional (3d) crystals examined using TEM often do not have atomic order, a fact that can be shown/confirmed using electron diffraction (e.g., while the image at the left shows the very high resolution diffraction information that can be obtained from a particular aquaporin-0 crystal inside an electron microscope, currently available 2d crystals of ChR2 (channel-rhodopsin-2) only diffract to ~6 Å).
The warning here is simply that if it has been or can be shown that a specimen will yield results showing order only to resolution X, it is foolish to collect at least initially only images that contain significantly more information than that resolution: higher resolution images will necessitate higher magnifications, will have smaller fields of view (and fewer single particles, unit cells, etc.) and may require changes in the data collection strategy that make high resolution work much more difficult than if the goal is more modest resolution.
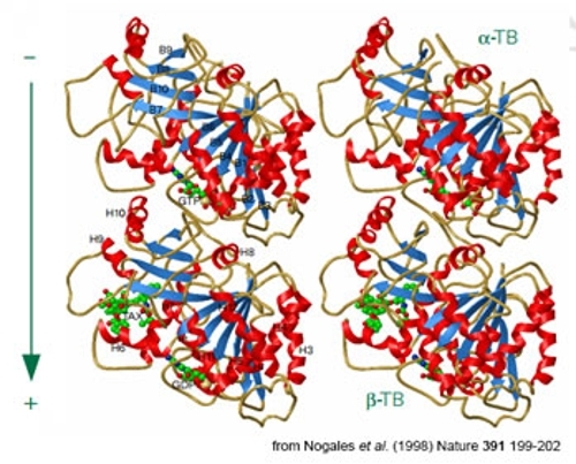
"Stereo view of ribbon diagrams of the α/β tubulin dimer bound with GTP" from Nogales et al. (1998) Nature 391, 199-202.
However, bear in mind that new approaches in sample preparation applied to old samples sometimes results in significant improvements in the data one obtains. In fact, this is exactly what happened in the case of zinc-induced tubulin sheets: relatively subtle changes in the crystallization procedure produced much larger, less polymorphic 2d crystals that were ultimately solved using EM to atomic resolution. For example, the figure to the right shows a stereo view of ribbon diagrams of the α/β tubulin dimer bound with GTP. So just because no-one has ever seen high resolution images from a given specimen, that doesn't mean one shouldn't try a new sample preparation approach! The caveat here is really intended to urge people starting any project to set modest goals and work towards higher resolution if and when a particular sample behaves well.
How Has the Specimen Been Prepared?
Just as a particular specimen can impose resolution limits on what can be observed, different specimen preparation techniques can also impose their own resolution limits.
The most commonly encountered specimen preparation resolution limit is probably associated with the use of various negative stains. Many people will say that negative stains limit the resolution of a biological sample to 20 Å, others will say 15 Å and yet others will give a different value. People will say that some negative stains are finer-grained than others and that these fine-grained stains can preserve higher resolution information. As a general rule, single particle reconstructions from biological complexes embedded in negative stain are usually described as having resolutions of 20 to 25 Å. Few 2d crystals embedded in negative stains have been fully solved in 3d (and even tracking those that have been solved is difficult), but depending on the unit cell of the 2d crystal, resolutions of 15 Å are not uncommon when evaluating the FFT's of images of such crystals. There is also at least one example of a helical reconstruction of actin/scruin fibers stained using uranyl acetate with a resolution of 13 Å. The bottom line is that if the specimen is prepared in any sort of negative stain, recording images that could be used to attain resolutions significantly higher than 10 to 12 Å is a waste of time and resources.
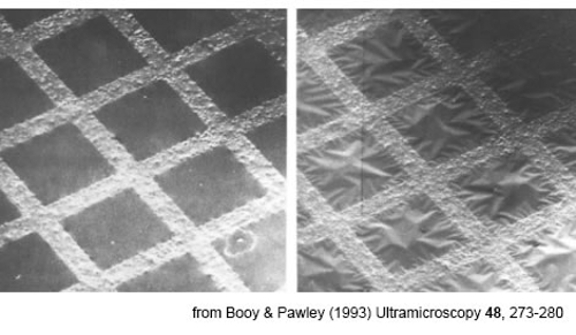
"A pair of scanning electron microscopy (SEM) images of a continuous carbon film on a 400 mesh copper grid" from Booy & Pawley (1993) Ultramicroscopy 48, 273-280.
Another sample preparation issue that has been studied fairly extensively involves how the material of a TEM grid and the support film on that grid behave when cooled to liquid nitrogen temperatures. This phenomenon is described in various publications as cryo-crinkling. The figure to the right shows a pair of SEM images of a continuous carbon film on a 400 mesh copper grid, where the leftmost image was recorded at room temperature and the rightmost image was recorded at -170 °C. This issue is especially problematic when using continuous carbon films and tilting a supposedly flat sample (e.g., a 2d or thin 3d crystal) in the electron microscope. The fundamental issue is that the linear thermal expansion coefficients for amorphous carbon films and various metals can differ significantly, and as the grid and carbon support film are cooled to liquid nitrogen temperatures, the support film puckers and wrinkles because of differences in the size of the cold materials.
Solutions such as the use of molybdenum grids (with a linear thermal expansion coefficient closer to that of the amorphous carbon film) and non-continuous support films (holey or lacy films, which seem less prone to the cryo-crinkling effect in ways that are not well understood) exist for this cryo-crinkling effect. The effect is also mainly a problem only for crystalline materials where the overall flatness of the sample is critical to obtaining useful images when tilting the specimen (and other approaches such as the symmetric carbon sandwich technique for 2d crystals have been shown to be useful in some cases in dealing with this flatness issue). The recent introduction of holey gold films supported on gold grids is a recent innovation that deals with both the issue of cryo crinkling and also with specimen charging.
Does the Specimen Show Signs of Radiation Damage?
Virtually all specimens examined in a TEM will eventually exhibit signs of radiation damage, though the electron dose needed to show a significant effect can differ enormously between biological and non-biological (e.g., soft and hard) materials. Electron beam damage (aka radiation damage) is obviously a factor for frozen, hydrated organic materials, where bubbles appear after the specimen has been exposed to enough electrons, but radiation damage at relatively low doses has also been shown using a 2d crystal prepared by freezing or embedding in a sugar such as glucose.
For example, 2d crystals of bacteriorhodopsin embedded in glucose show atomic resolution electron diffraction inside the TEM, and it is possible to observe an electron dose dependent reduction in the amplitudes of diffraction maxima (aka, crystallographic reflections) in the diffraction pattern. Each crystallographic reflection shows a different degree of amplitude reduction for any given dose of electrons, but there is also an overall correlation between lose of amplitude and resolution as a function of electron dose: for the same electron dose, high resolution reflections lose amplitude faster than low resolution reflections. Extensive work has been done to quantify this radiation damage effect as a function of temperature (both at liquid nitrogen and liquid helium temperatures), and there is clearly a cryoprotection effect that makes biological materials more resistant to radiation damage as the temperature is lowered.
These studies were part of the impetus for the cryo portion of the cryoTEM field, and they are the source of the oft-repeated claim that a dose of less than 10 electrons/Å 2 is necessary to prevent radiation damage. It should be noted here that the lowered temperatures are not really slowing the amount of damage (e.g., carbon-carbon bond breakage caused by the ionizing electrons), but rather the lowered temperatures are simply masking the effect of the damage (e.g., diffusion of material away from the site of bond breakage) for a brief while. It is also very important to note that while it is less obvious, radiation damage is still a major concern for most biological specimens embedded in negative stain.
The concept of radiation damage also becomes extremely relevant to the choice of magnification when considering the electron dose that hits the specimen and the area of the recording device (CCD or film, hereafter simply called "the detector") over which that dose is spread. For example, if the electron dose is set to 10 e-/Å 2, and the magnification changes from 20,000 to 40,000, the electron dose per unit area at the detector is reduced by a factor of 4. Fewer electrons per unit area equates to a lower signal (and lower signal-to-noise) and if one needs or wants to severely limit the electron dose in terms of e-/Å 2, there comes a point where the magnification is so high and the dose is so low that there is effectively no signal left at the detector.
This is especially relevant when thinking about cryoET, but can also be a factor for low dose imaging at the high magnifications needed for atomic resolution cryoTEM.
Radiation damage has even been shown recently to effect certain hard materials such as...content coming soon!
cryoTEM
One of the goals of many cryoTEM projects is an atomic or near-atomic resolution structure of an isolated biological complex. There have been enough recent success stories with crystalline, helical, icosahedral and non-symmetric single particles to say that while such a goal may be difficult to attain, it should be possible in many cases. However, not all biological complexes are this highly ordered, at least not as they have been prepared for TEM at the present time. For example, there are numerous two-dimensional (2d) crystals that are well-enough ordered to solve their structure at (say) 8 Å, but that have proved recalcitrant to all higher resolution studies.
What Factors Should I Consider?
Camera
Pixel size in the image
Typical atomic spacings range from the separation between layers of graphite (3.4 Å) to the separation between atoms of a metal such as gold (2.35 Å). Using our JEOL JEM 3200FS, the graphite spacing can be seen at as low a magnification as 80,000 (or perhaps even 60,000) and the gold spacing can be seen at 100,000 (and even 80,000 in some images). However, these lowest estimates of the magnification really address what could be described as a relatively ideal specimen imaged under the best conditions.