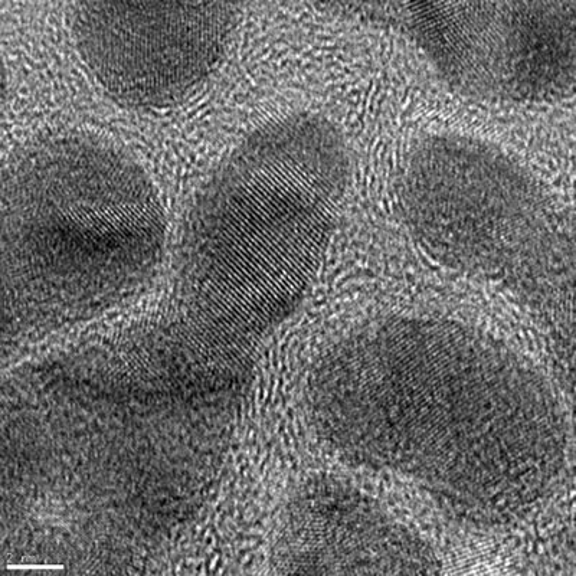
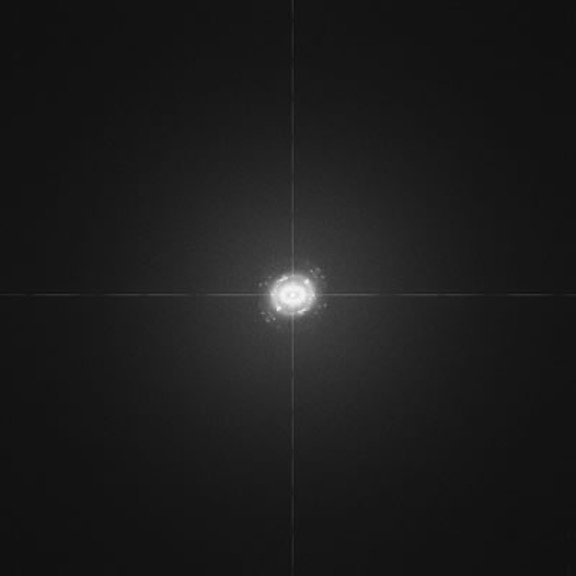
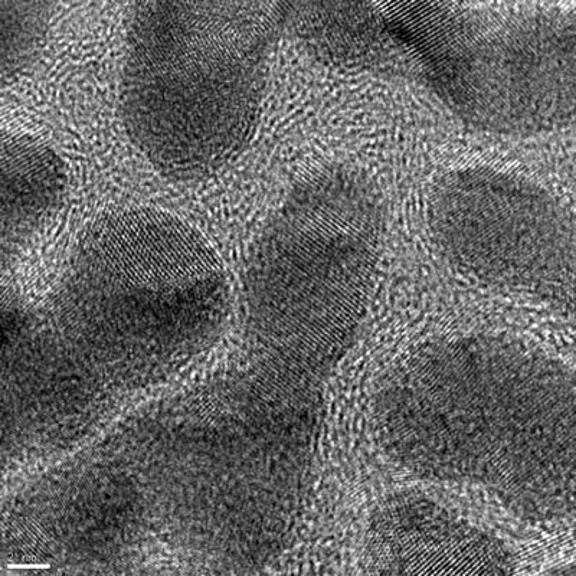
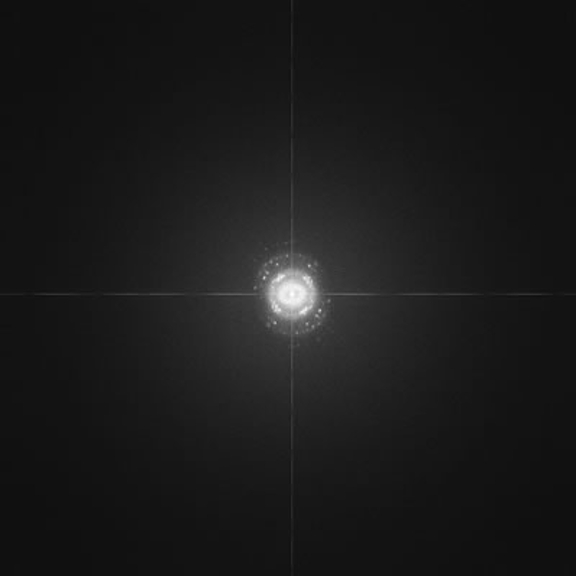
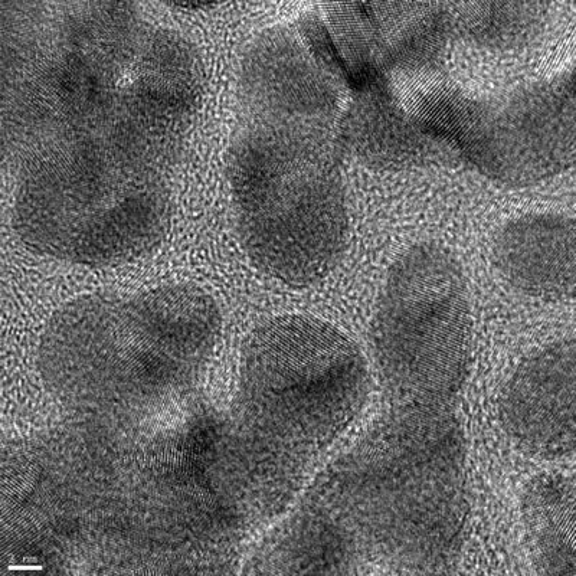
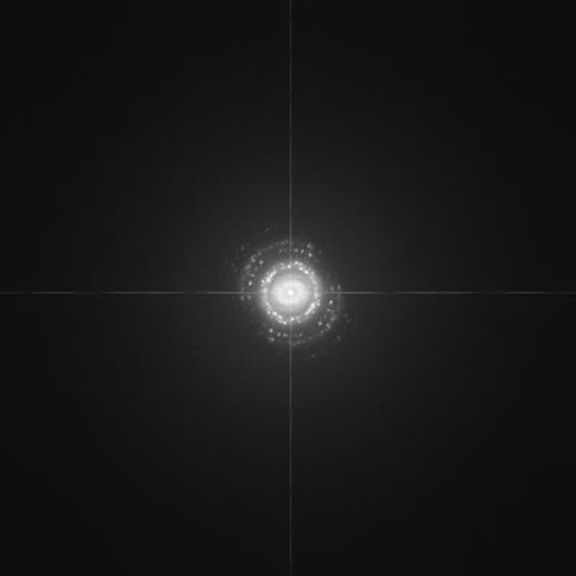
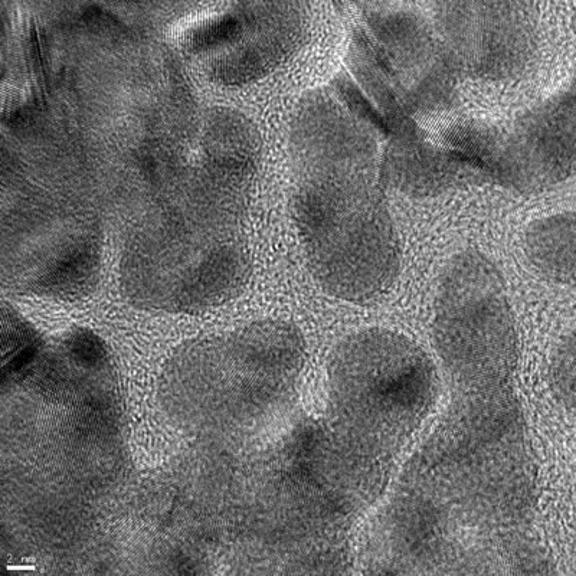
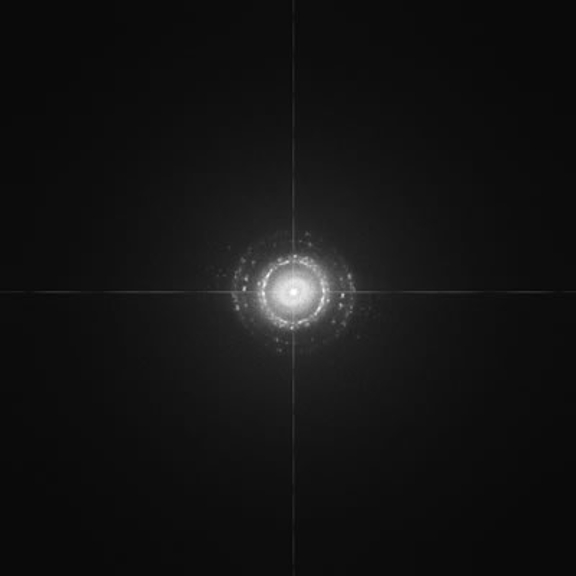
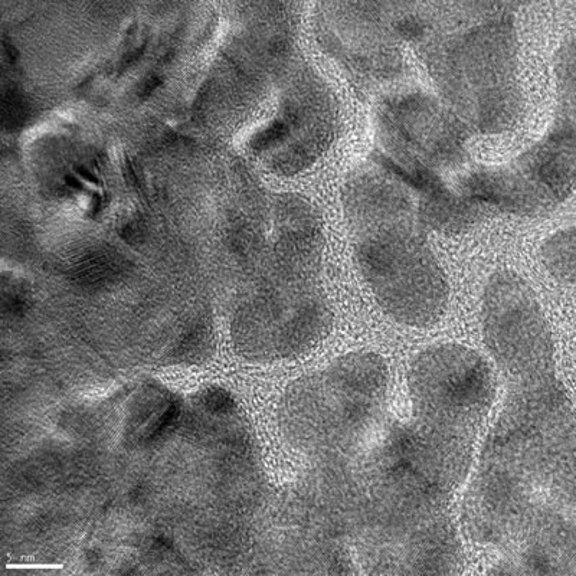
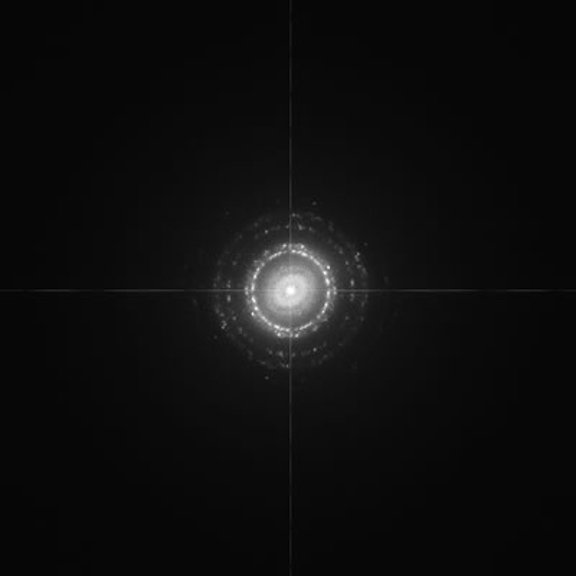
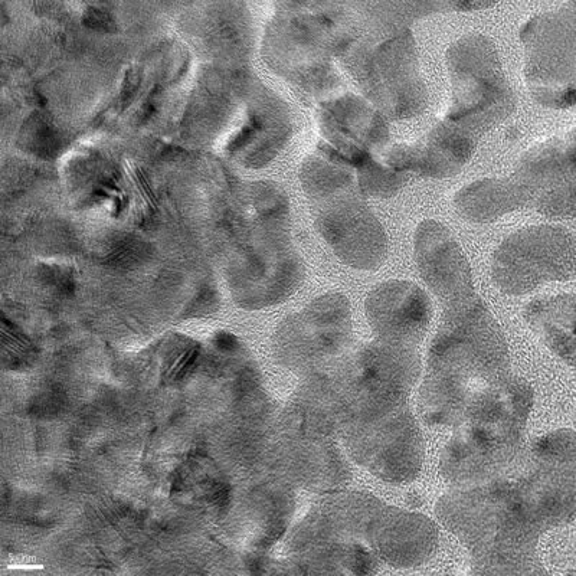
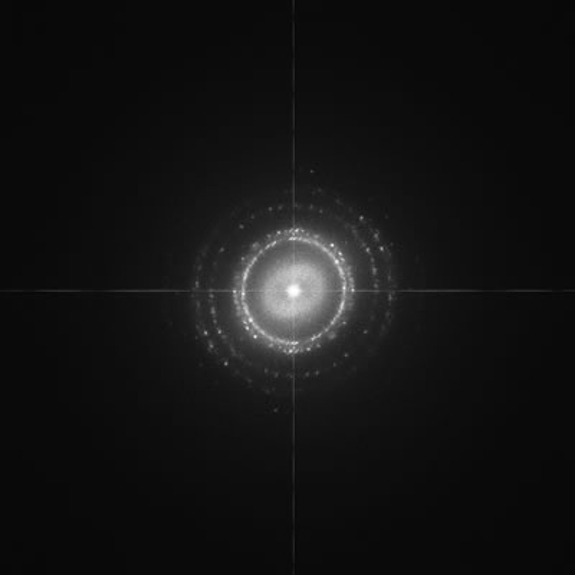
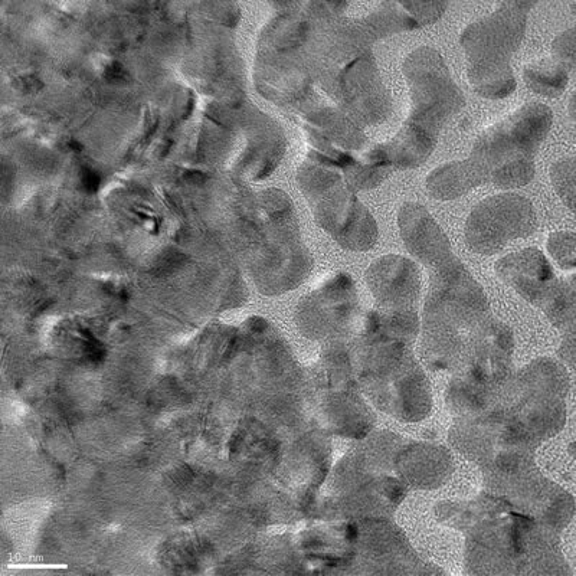
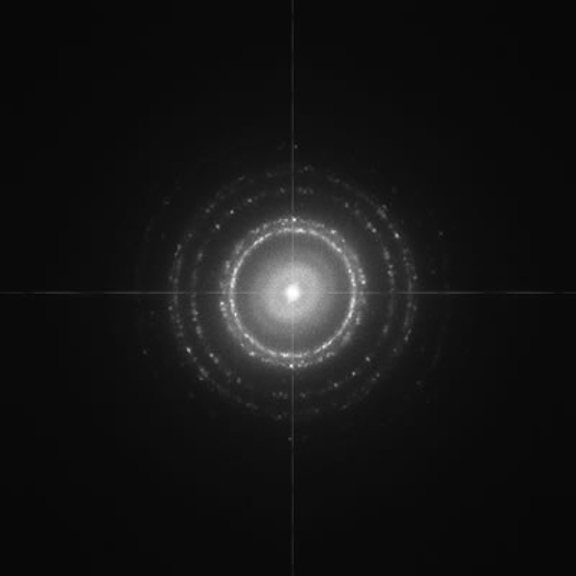
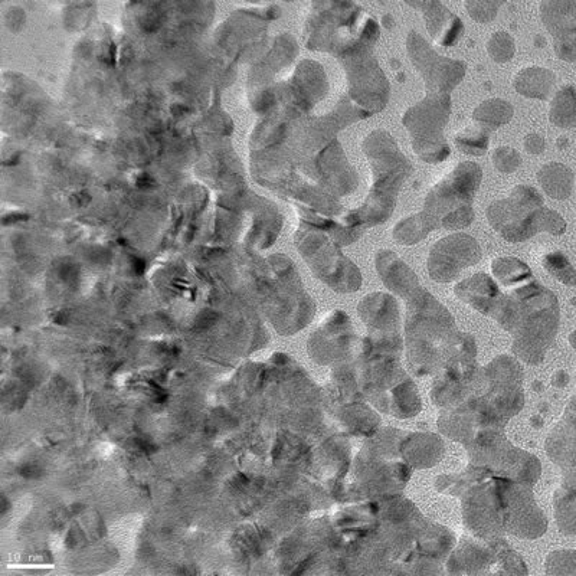
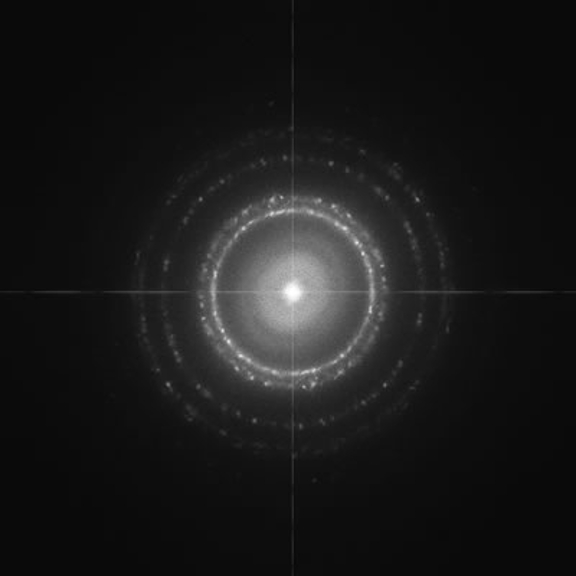
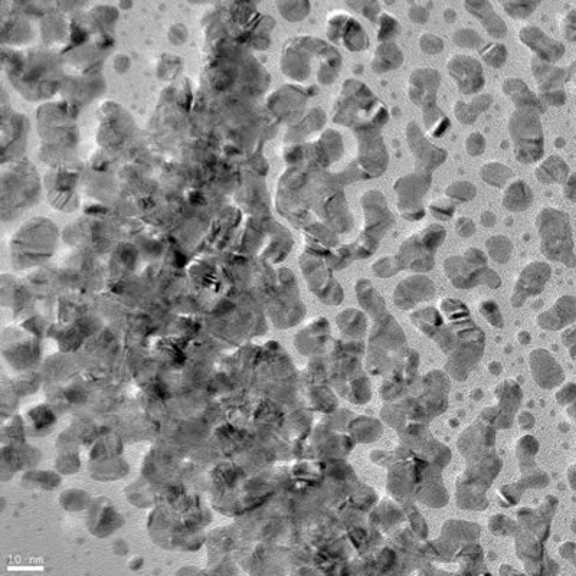
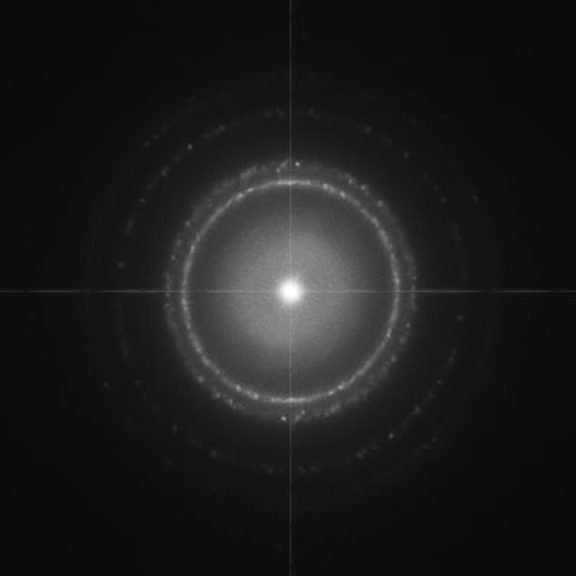
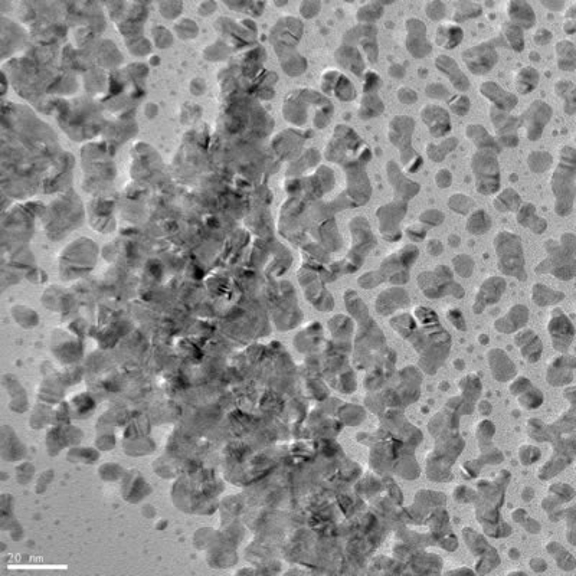
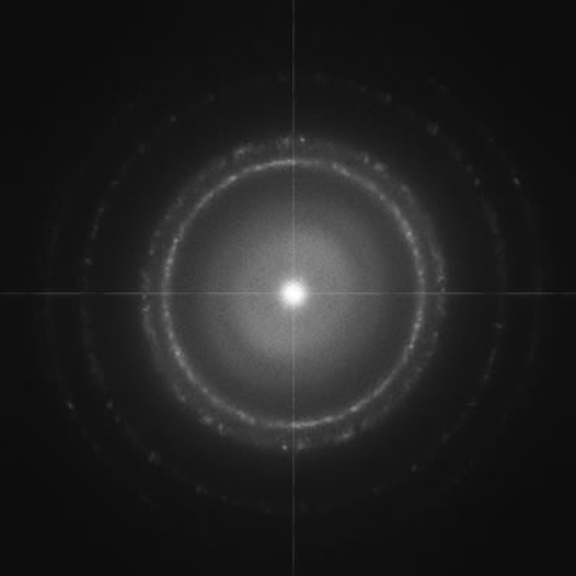
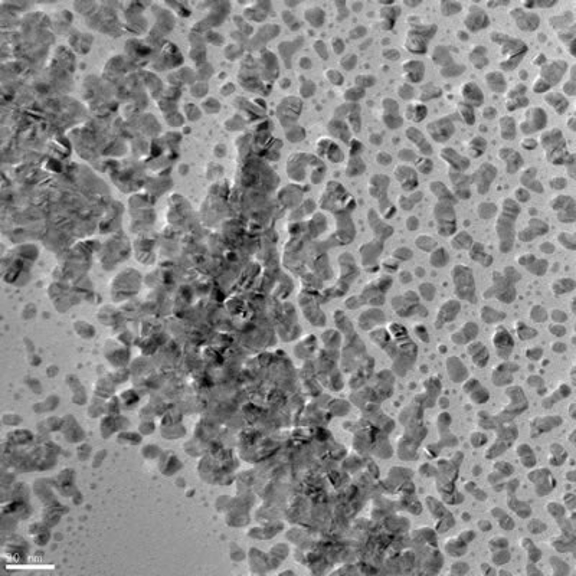
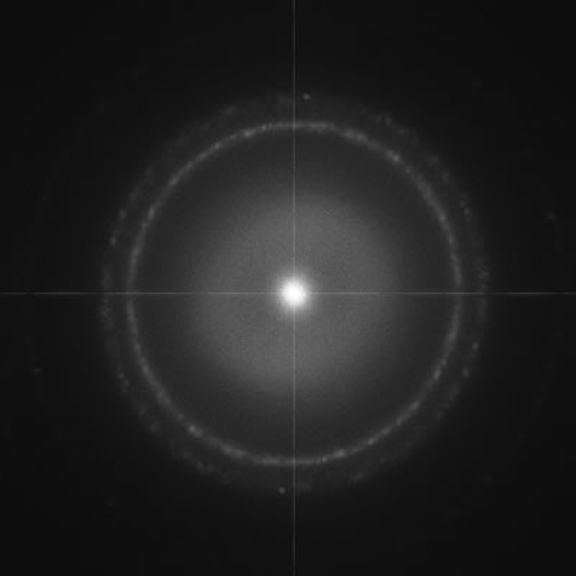
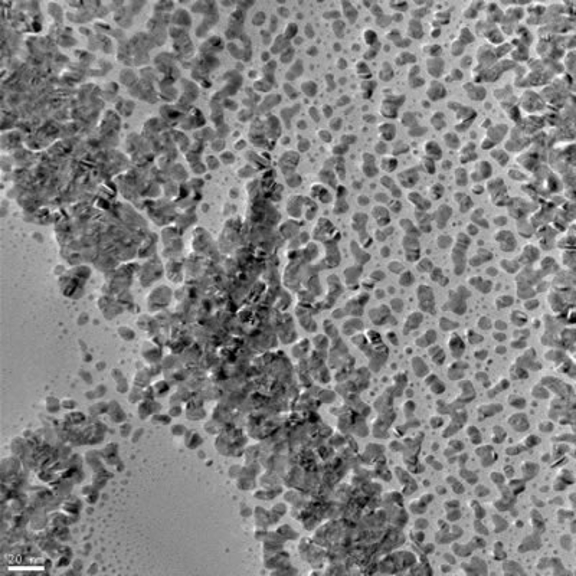
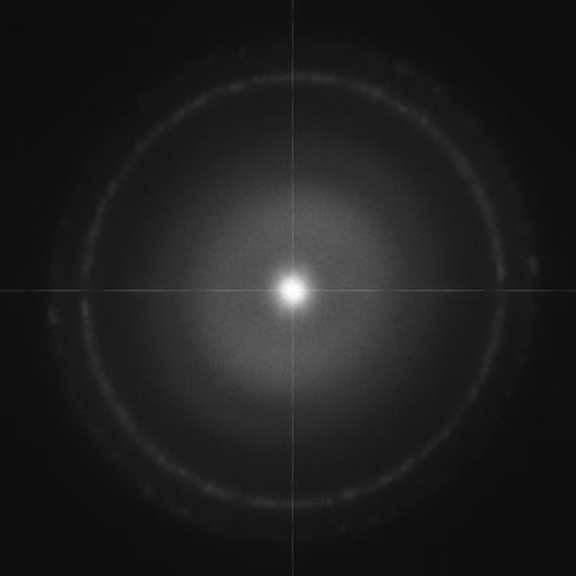
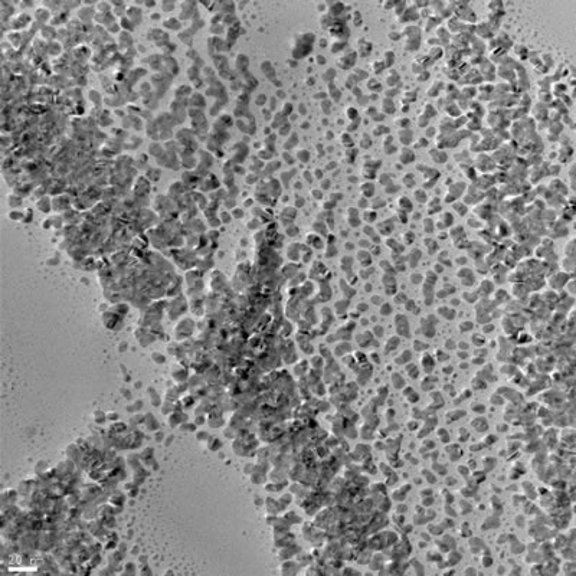
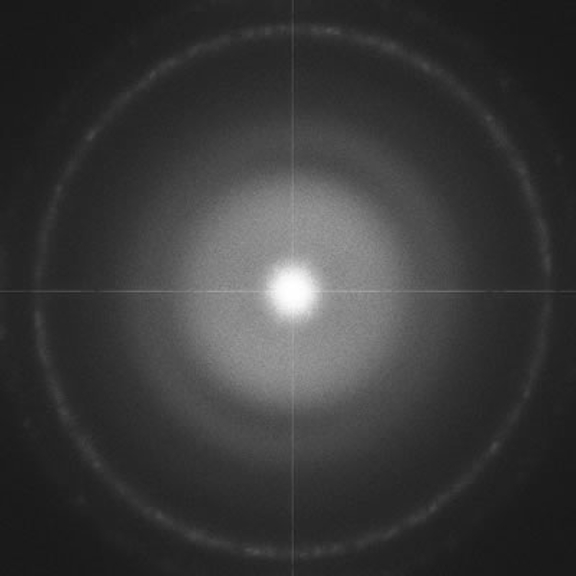
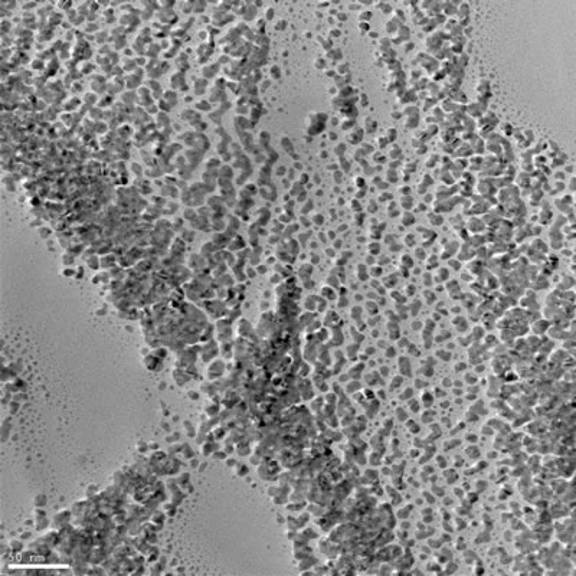
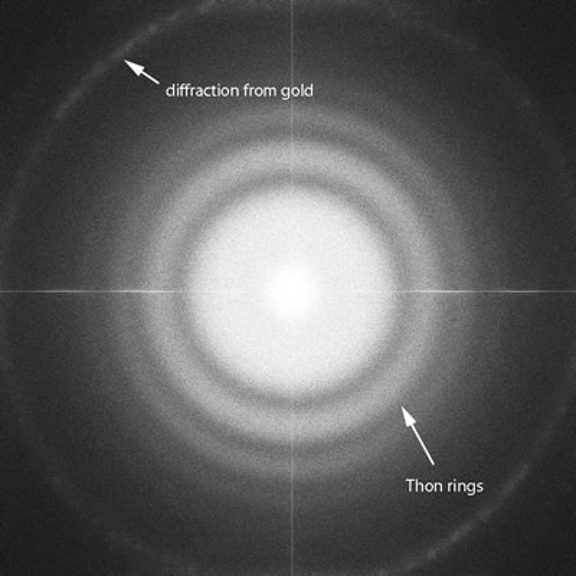
The images shown here are 4k x 4k images recorded from a replica diffraction grating calibration grid (often referred to as a waffle grid with latex spheres) using the UltraScan 4000. The images start at the highest available TEM magnification on the JEOL JEM 3200FS and step down from there. Although an image was recorded at every available magnification, only those that reveal diffraction from the islands of (poly)crystalline gold are shown here.
It can be seen from the last images on this page that the image recorded at a nominal magnification of 120,000x (with a pixel size of 0.99 Å) clearly shows the 2.35 Å diffraction from the gold lattice (where the Nyquist limit is 1.98 Å). Even the image recorded at the next lower mag (100,000x, with a pixel size of 1.2 Å and a Nyquist limit in the x- or y-direction of 2.4 Å) clearly shows the 2.35 Å diffraction in the "diagonal direction" of the Fourier transform (we offer an explanation on data near or beyond the Nyquist limit). Both these observations indicate that there is considerable signal in these images near the Nyquist limit, even though the signal is considerably weaker than it should be (follow the strength of the 2.35 Å ring as the magnification drops and the position of the ring moves closer to the edge of the FFT).
NOTE: The images and FFTs shown below have been cropped by ~2% from their highly binned display in DigitalMicrograph. The most significant impact this has is on the FFTs, where instead of the edge of the displayed FFT corresponding to the absolute edge of the FFT, a bit more of the FFT does actually exist.
View images displaying information usually filtered out by the Nyquist Frequency


