It is critical to know the electron dose when doing minimal dose imaging of frozen, hydrated biological samples in order to minimize the radiation damage caused by each exposure. There are also times when one needs to control the total electron dose that a specimen receives during data collection for electron tomography (especially cryo electron tomography) or when performing radiation damage studies, It is also generally a good idea to have some estimate of the electron dose that any specimen receives, since it is easy to not see damage in hard materials until and unless one is specifically looking for it. Depending upon how a particular electron microscope has been calibrated, there should be a variety of ways for a user to estimate the dose that a particular sample experiences.
Estimating the Electron Dose in TEM


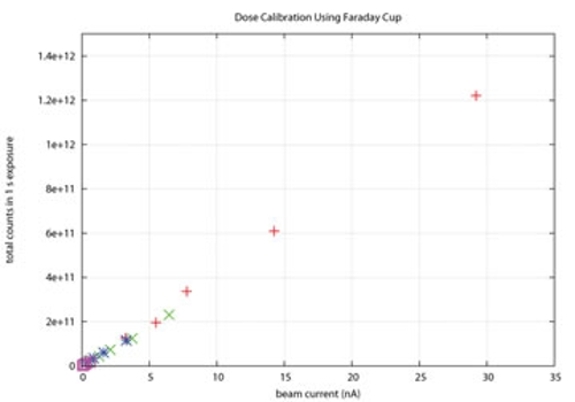
For example, a calibration procedure using a Faraday cup was used to measure the beam current in the Electron Microscopy Center's JEOL JEM 3200FS. The beam current was systematically varied (using all possible combinations of the different condenser apertures and spot sizes - in the plot to the left, spots sizes from 1 through 5 are color coded and occur in groups of four as the condenser aperture grows smaller and smaller) and measured with the Faraday cup. Knowing the beam current for these combinations then allows the user to predict the electron dose a specimen receives by estimating how much of the beam actually interacts with the specimen. For example, it should be possible to estimate the fraction of the beam that is captured by a CCD camera when the electron beam is spread to cover the large phosphor screen on any given TEM. Since the Faraday cup provides the total electron dose for any combination of spot size and condenser aperture, knowing this fraction of the total screen area would allow a user to estimate the total number of electrons that interacted with the specimen that is recorded in any image. If the specimen of interest (say a metallic nano-particle) only occupied a fraction of the recorded image, it would also be possible to determine what fraction of the beam interacted with a particular particle.
Although such Faraday cup measurements can be used to determine the strength of the electron beam in a given image (provided that the imaging conditions were carefully controlled), a more important question is the electron dose per unit area that the specimen experiences. One can extrapolate from total beam current to electron dose per unit area provided the area illuminated by the electron beam is known (and most CCD cameras will have a calibrated pixel size at all available magnifications). If one knows the total electron dose in an entire image, it should be possible to divide by the area of the image and generate a dose per unit area (measured in anything from coulombs per square centimeter to electrons per square Ångstrom). This is fundamentally just an extension of what was described in the preceding paragraph, and again depends on knowing exactly how an image was acquired and calculating afterwards what dose the specimen received.

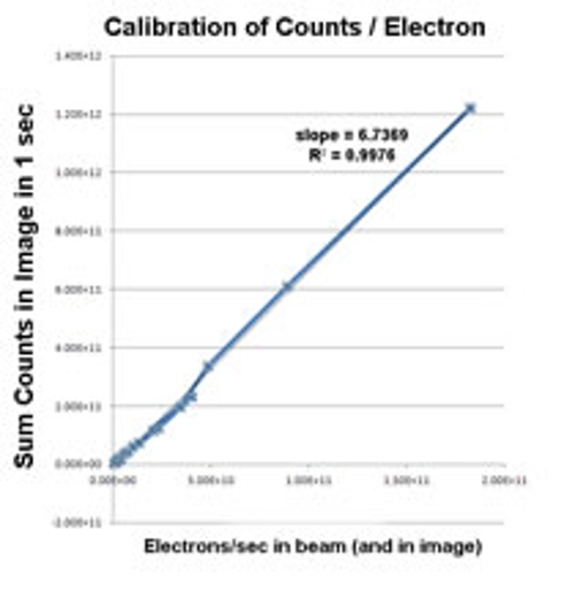
A more practical approach is to use the Faraday cup readings and to record simultaneously images with a particular camera (e.g., the Gatan UltraScan 4000 on the EMC's 3200FS). Such images must be recorded without a specimen in the electron beam path (so no scattering from the sample occurs) and such that the entire beam only covers a portion of the CCD frame (so that the total beam current is recorded in the image, meaning that the Faraday cup's reading can be directly related to counts in the image). Since the total beam current, the pixel size at any given magnification and the exposure time of these images are known, it is possible to determine the number of electrons that interacted with the CCD and to determine the average counts per electron that a particular camera produces. For the Gatan UltraScan 4000 on the EMC's 3200FS, that number is about 6.7. Once this value is known, it is then possible to determine the electron dose simply by recording any image where there is nothing in the beam path, and relating the average counts in such an image to the electrons per pixel (and then per nm2 or Å2).
Similar calibrations are often built into various pieces of software such as Gatan's DigitalMicrograph (DM) and serialEM (the tomography program from the Boulder Laboratory for 3-D Electron Microscopy of Cells). For example, DigitalMicrograph can be configured to display "calibrated" images, where image dimensions and distances between features are measured in µm or nm and pixel values are reported in electrons. When DM displays uncalibrated images, distances are reported in pixels and pixel values are reported in CCD counts. When DM was installed on the EMC's 3200FS, calibrations were done to determine pixel sizes at the different magnifications and a number to convert counts into electrons. However, that calibration of counts per electron was ~12 whereas recent work with a Faraday cup indicates that the value should be ~7. In addition, the values for electrons/pixel that DM generates reflect the number of electrons that actually interact with the CCD and not what was experienced by the specimen. In other words, electrons that were scattered out of the final image or removed from the image by the energy filter cannot appear in the CCD record but were part of the incident electron dose that the specimen received. That means that a dose estimated from the "electrons" that appear in the image will always be an underestimate of the incident dose (and in commonly encountered situations, this can be a significant underestimate).
serialEM also makes use of such calibrations. Pixel size calibration is an explicit part of the software installation and is straightforward enough that in most circumstances, serialEM pixel sizes are likely to be more trustworthy than DM pixel sizes. serialEM also creates and uses its own gain and dark references, and is able to correlate the settings of the electron microscope with these reference images and with a conversion factor between counts and electrons to estimate the dose of the incident electron beam during tilt series acquisition. This estimate is not based on the counts present in acquired images, but rather is truly an estimate of the incident electron beam used for all images recorded while a tilt series is being acquired.
The phosphor screens on most TEM's (if present) are often coupled to some sort of current reading. On the 3200FS, both the large phosphor screen (160 mm diameter) and the smaller focusing screen (25 mm diameter) give output (measured in pA/cm2) about the strength of the beam. The large screen directly reads the current produced by electrons that hit it, while the focusing screen generates a calibrated output. Because of this, the two readings will be different (and the large screen reading will generally be more accurate). Keep in mind that the pA/cm2 reading is only accurate if the entire large (or small) screen is illuminated by the electron beam. In other words, when the large screen measures the current of the electron beam that hits it, the output screen current value is calculated assuming that the current is evenly distributed across the entire screen (and simply takes the measured current and divides by the area of the large screen: ~201 cm2).
Also, similar to the way DigitalMicrograph reports electrons per pixel in the image and not the incident electron beam as it hits the specimen, measurements made on the phosphor screens are reporting electrons after they have passed through the specimen, post-specimen apertures and the energy filter. With these warning in mind, it is possible to use the screen current readings to help maintain consistency of the electron beam strength across a series of images from the same grid, and to provide a measure of day-to-day consistency while examining similar samples.
Finally, starting at the end of the summer of 2014, David Morgan (as part of his daily alignment procedure for the 3200FS using a standard replica diffraction grating or waffle grid) has been recording the reading from the large phosphor screen when the magnification is set to 200,000x and the beam covers the entire screen. This is an easy way to monitor significant changes in the strength of the electron beam over time (with the caveat that subtle changes due to the exact composition of the waffle grid illuminated by the electron beam will definitely cause fluctuations in the readings even when the actual beam current has not changed).

