Tomography

Electron Tomography (ET)

The fundamental concept behind tomographic reconstruction of all sorts is that it is possible to construct a three-dimensional (3d) representation of a 3d object by combining two-dimensional (2d) projection images of the 3d object. It will be useful for the rest of this discussion to present some of the history of this field, both to clear up certain misconceptions about tomography and also because the field uses several different terminologies and formalisms when dealing with the relationship between a 3d object and its 2d projections. The "N-dimensional" mathematical proof behind the relationship between objects and projections and the "Radon transform" itself were introduced by the Austrian mathematician Johann Radon in a hard-to-locate article published in 1917. For various reasons, Radon's treatment of the problem had very little practical impact at that time but was of enormous interest to people working in areas of pure mathematics such as integral geometry and partial differential equations. Even today, although many people make reference to Radon and Radon transforms when talking about tomography, Radon's approach to the problem is seldom actually used.

In the 1950's, the physicist Allan Cormack developed the theoretical underpinnings that led to the field of X-ray computed tomography (CT) used in medical imaging. CT was a practical demonstration of the relationship between a 3d object and 2d projections (X-ray images, in this case). Cormack's early work was done without any knowledge of Radon's mathematical treatment: Cormack notes in his 1979 Nobel lecture that he only learned about Radon's work (and the work of various other people in the area we now call tomography) in the early 1970's when returning to CT-scanning problems. Cormack not only developed the mathematics for dealing with the problem of generating a volume based on a set of X-ray images collected at various angles relative to the original 3d object (various back-projection algorithms), but he also produced a practical demonstration of the theory using an X-ray source and a physical "phantom object" that mimicked the properties of the human body. In addition, Cormack described how noise in the X-ray images propagates into reconstructed volumes and developed practical ways of dealing with these effects. Cormack and the electrical engineer Godfrey Hounsfield (who built the first practical CT scanner) received the 1979 Nobel Prize in Physiology or Medicine "for the development of computer assisted tomography."

Another formalism that describes the relationship between 3d objects and 2d projections was developed by David DeRosier and Aaron Klug in the mid-1960's at the Medical Research Center's Laboratory for Molecular Biology in Cambridge, England. According to DeRosier, this work was done independently of both Radon's mathematics and Cormack's more practical work. The DeRosier and Klug description of the relationship between a 3d object and its 2d projections should be familiar to everyone in the field of cryoTEM and is known either as the projection theorem or the central section theorem (which more closely ties the name to the concepts behind it). In essence, the central section theorem states that the Fourier transform of a 2d projection of a 3d object is a central section (i.e., a section passing through the origin of the transform) of the Fourier transform of the 3d object. When the 3d reconstruction problem is considered using this framework, it is relatively easy to see how it should be possible to fill 3d Fourier transform space with the 2d Fourier transforms from a series of projection images at different tilt angles and to generate a 3d reconstruction simply by inverse Fourier transforming that (partially filled) volume.

Details of Electron Tomography

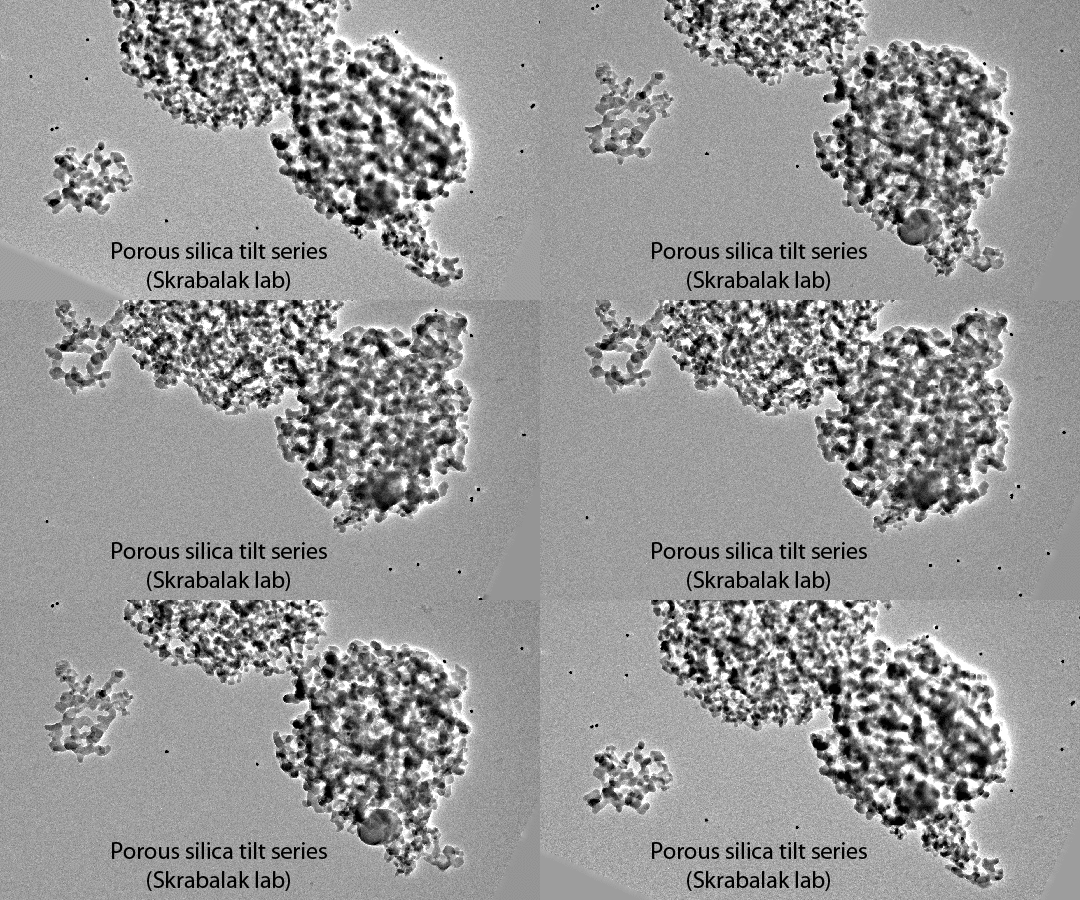
A moving image showing the porous silica tilt series.

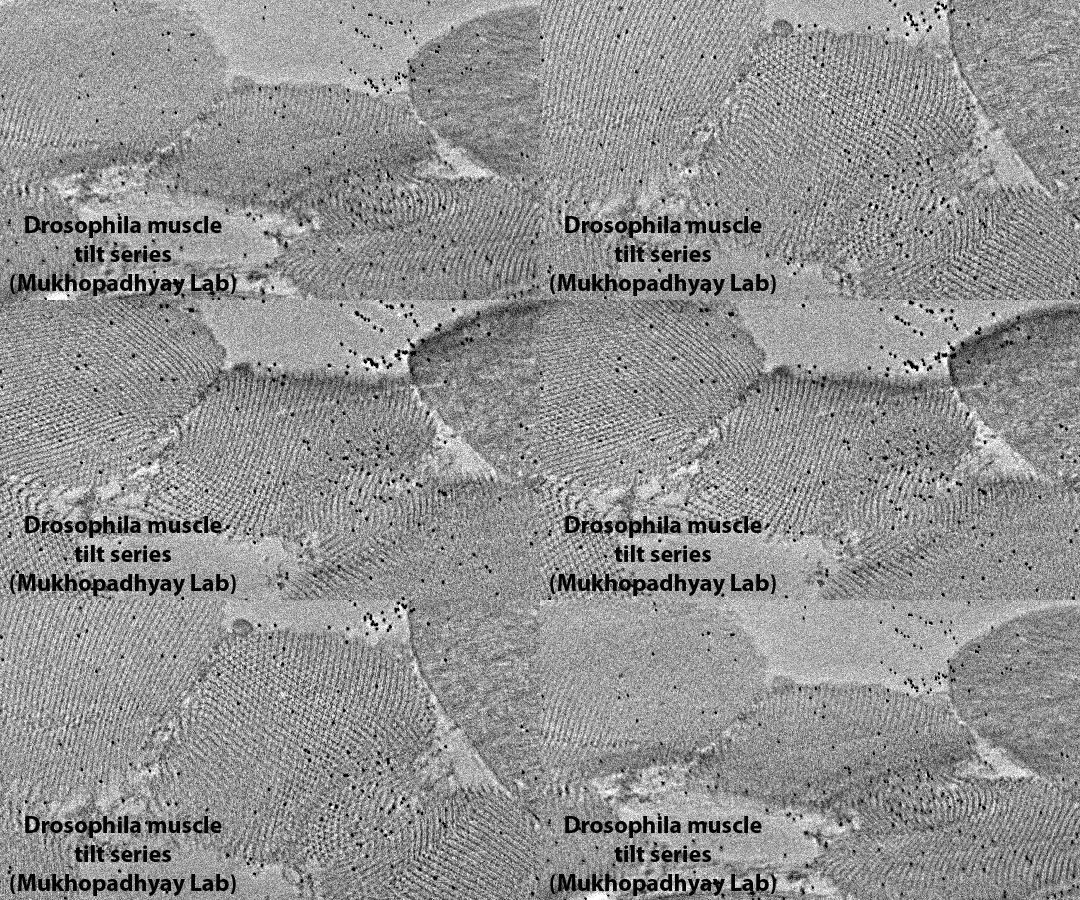
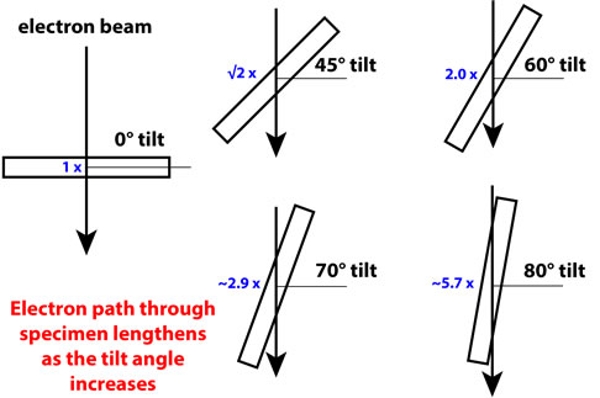
Electron tomography (ET) can be performed when a side-entry electron microscope is in either transmission electron microscope (TEM) or scanning transmission electron microscope (STEM) mode. In both cases, the fundamental idea behind ET is that the user records an image of a particular area of the specimen, tilts the microscope specimen holder by a known amount and records a new image of the same area. This process is repeated until the tilt angle reaches the limit of a particular holder or until the specimen can no longer be imaged because the electron beam is blocked by a grid bar, by the holder itself, etc.

This tilting process can start at large positive or negative tilt and proceed to the opposite extreme. It can also start at zero tilt, record images as the holder tilts toward large positive tilt then jump back to zero and record images as the holder tilts towards large negative tilt or it can start at zero tilt, record images as the holder tilts toward large negative tilt then jump back to zero and record images as the holder tilts towards large positive tilt. There are advantages and disadvantages to all of these data collection schemes (and different automated data collection software packages may be restricted to one of them), but the major concern is that each image must have an associated tilt angle.

Although the sequence described above (record image, tilt specimen, record new image, tilt specimen further, etc.) is fundamentally extremely simple, things are not nearly so simple when a real specimen and a real electron microscope are used. The fundamental problems encountered during data collection for tomography are the imperfection of the microscope's goniometer (the mechanism in a side-entry (S)TEM instrument that allows the specimen holder to tilt) and the lack of absolute flatness for most (S)TEM grids. Lack of specimen flatness only exacerbates other problems caused by the imperfections of the goniometer, and most of the rest of this section will focus on the problems of the goniometer. Before dealing with goniometer issues, a brief description of certain microscope properties and features is useful.

A moving image showing the drosophila muscle tilt series.

The optics of many (S)TEM's are designed to work best at a particular position along the beam path of the instrument. This position is coupled to empirically-determined objective lens conditions that JEOL microscopes call standard focus and that FEI microscopes call eucentric focus. When a specimen sits at this special position along the beam path and when the objective lens is put into the standard focus condition, all images will be essentially at focus. The images can be defocused either by moving the specimen closer to or further from the electron source, or by changing objective lens settings. A user can check the self-consistency of a particular electron microscope by moving the specimen a certain amount along the beam path (the z position) and then returning the image to focus by adjusting the objective lens. When the microscope calibrations are self-consistent, movement in z (often measured with an accuracy of around 0.1 micrometers, μm) will closely match the change in focus (usually measured with an accuracy of a few nanometers, nm).

Since it is often possible to observe high-resolution transmission electron microscopy (HRTEM) image differences with changes in defocus smaller than 0.1 μm (i.e., the accuracy of the specimen position), this coupling between standard focus and position along the beam path is obviously limited by things like the precision to which the specimen can be moved along the beam path and how well the standard focus objective lens conditions have been determined. For all well-behaved (S)TEM's, standard focus should be well within a few μm of the optimal specimen position along the beam path.

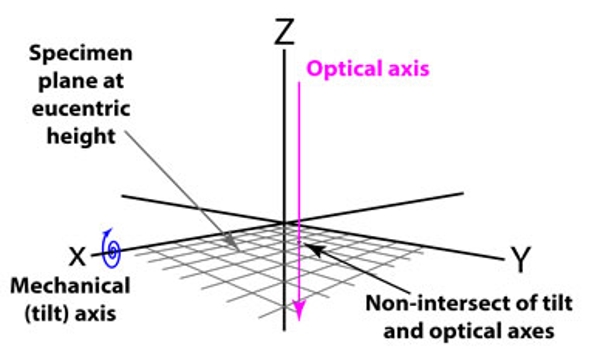
Goniometer geometry displaying the specimen plane at eucentric height, the optical axis, the mechanical tilt axis, and the non-intersect of tilt and optical axes.

Returning this discussion to goniometer issues, there is a line in 3d space that runs along and through the rod of a side-entry specimen holder that is called the specimen holder's rotation axis, the (holder's) mechanical axis or even more simply, the tilt axis. The specimen rotates around the tilt axis when the specimen holder's tilt is adjusted using the goniometer (as illustrated in the figure to the right, adapted from a presentation by Dr. Jacob Brink with JEOL USA). If the goniometer's geometry is described so that the x-axis runs parallel to and through the tilt axis and the y-axis is normal to both the x-axis and the electron beam (which becomes by default the direction of the z-axis), an adjustment of the entire goniometer in the y-direction (usually done by a service engineer) aligns the tilt axis of the holder to the optical axis (i.e., the tilt axis of the holder and the optical axis of the electron beam intersect). The user should then also adjust the goniometer in the z-direction (i.e., parallel to the beam path) so that the specimen is at the position described previously as the point along the beam path where the optics of the microscope perform best (which is also where standard focus should be set). This z-position that the user sets is sometimes also called the eucentric height or eucentric position. The microscope's description of the eucentric height (using its internally defined x/y/z co-ordinate system) will differ both from holder to holder (i.e., the exact location in z of the gird relative to the shaft of a holder can vary by more than 100 μm among the different holders for a single microscope) and on the physical dimensions and orientation of individual grids (i.e., the eucentric height will differ by the grid's thickness depending on whether the specimen is closer to or further from the electron source than the rest of the grid).

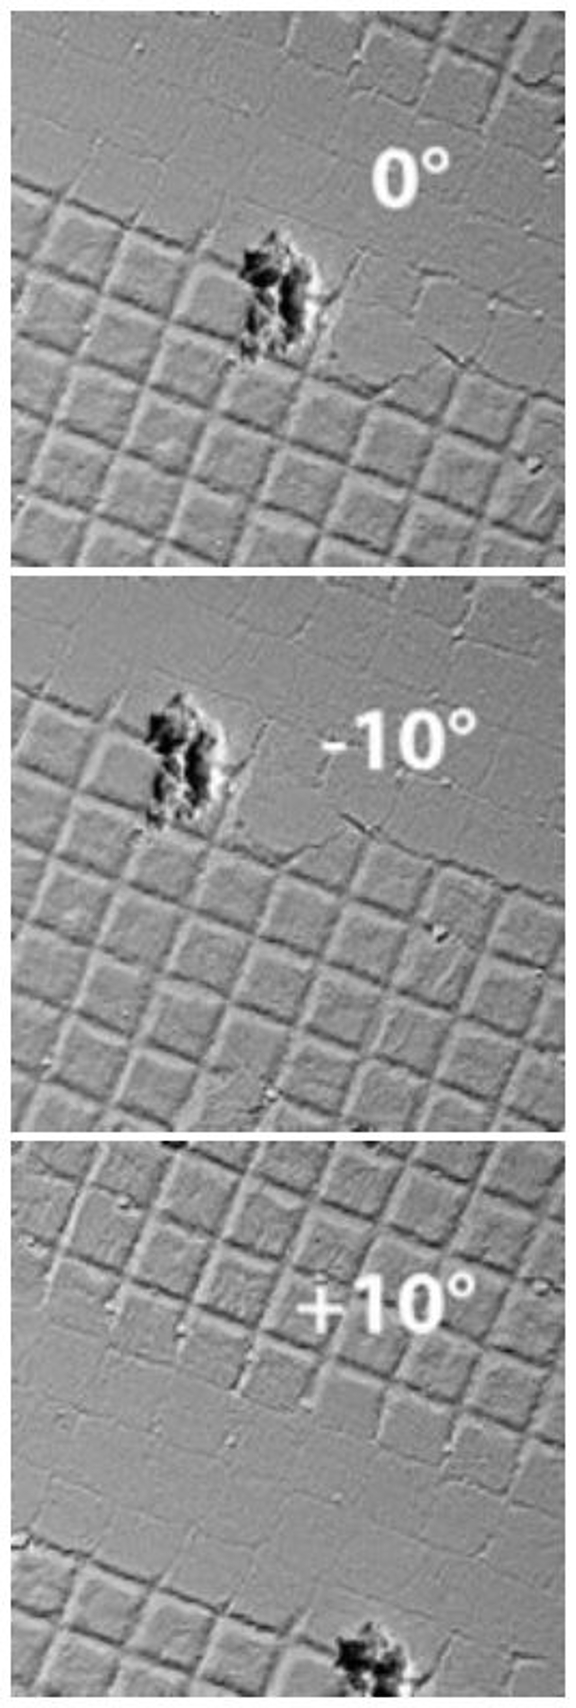
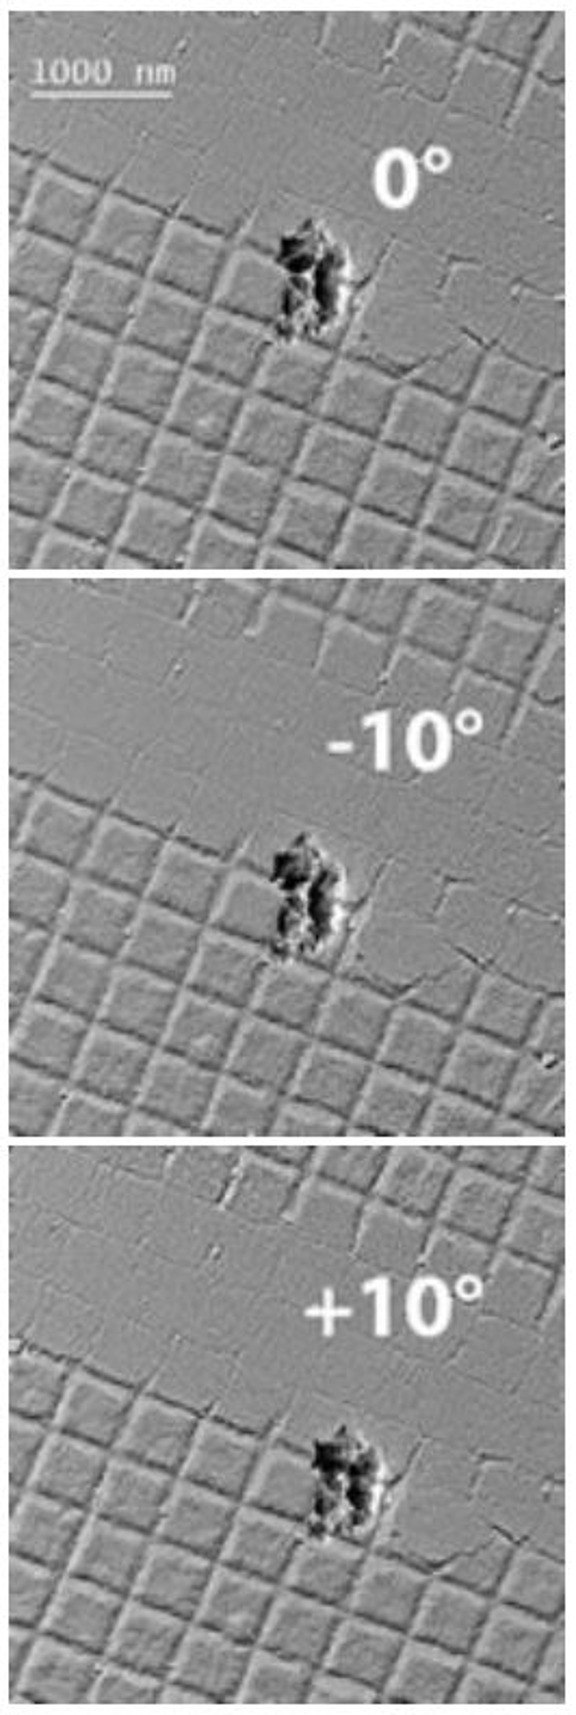
If the goniometer were itself perfect and everything else (including the eucentric height and flatness of the grid) were also perfect, it would be possible to set the objective lens conditions to standard focus, tilt the specimen holder to any angle and record an at-focus image of exactly the same part of the specimen as would be seen in images recorded at any other tilt angle. When the eucentric height is incorrect, tilting the specimen holder causes the image of the specimen to sweep in the y-direction (normal to the tilt axis), as shown in the first column of images at the right (where the tilt axis is roughly horizontal). After correcting the z-position, this sweep is much reduced, and the residual movement is likely because the tilt and optical axes do not intersect. The image sweep in this case will often happen only in the positive (or negative) tilt direction (and not both).

If this state of perfection were possible, collecting data for tomography would be no more complicated that what was described above: record an image, tilt the specimen, record a new image and simply keep repeating this process. However, goniometers are physical devices and are likely to have imperfections such that even when the goniometer has been carefully "tuned" and even when the specimen is located at the correct position, tilting causes the specimen to move slightly in x, y and z. This movement means that collecting data for tomography really involves recording an image, tilting the specimen, finding the same area that was recorded in the initial image, determining (and adjusting) the defocus, recording a new image and only then repeating these steps over and over.

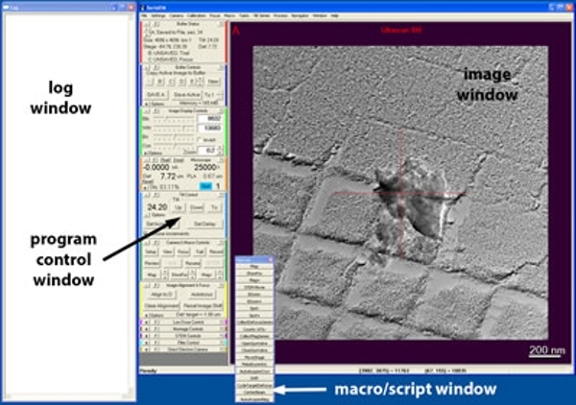
A human microscope operator can perform these steps, but the process is slow, involves extensive exposure of the sample to the electron beam and (from personal experience) is prone to errors as the number of recorded images increases (and keep in mind both that individual tomographic data sets can have more than 100 images and that a given project could require dozens of data sets). Because of these factors, the integration of computers into (S)TEM instruments has been crucial for ET to become a commonly practiced technique. The current generation of side-entry electron microscopes are all capable of "automated" ET (i.e., the user selects an area for tomography, sets parameters such as the tilt limits, the angular increment between images and the defocus for each image and then lets the computer acquire the images). With a well-behaved specimen, such computer control can record a complete tilt series in significantly less than an hour, allowing the user to collect a dozen or more data sets in a single session at the microscope. When these steps were all done manually, it was seldom possible to acquire more than 3 or perhaps 4 data sets in a single session, and operator error often made the last data sets and last images worse than those from the beginning of the session.