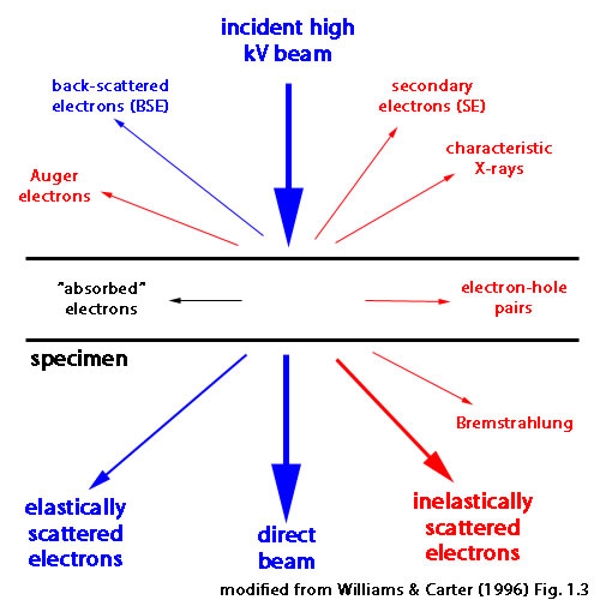
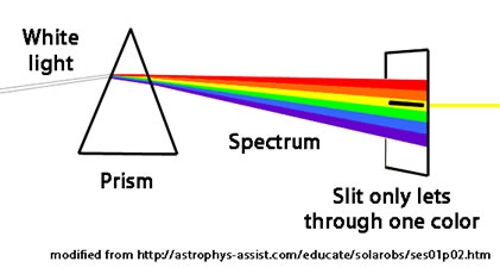
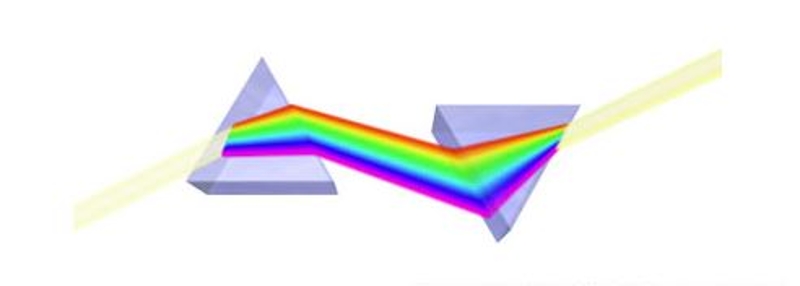
The idea underlying energy filtered transmission electron microscopy (EFTEM) is to limit the energy spread (equivalently, the multiple wavelengths) of the electrons that form the image. This process (and most others that involve EFTEM) can be easily and clearly illustrated using white light as shown in the figure to the right: the beam of white light can be split into its constituent colors by (for example) a glass prism and all the wavelengths (energies) that are not yellow can be eliminated using a slit. In this example using visible light, the highest energy wavelengths are in the violet region of the spectrum and allowing the yellow light to pass through the slit means that lower energy photons (relative to the violet region) are being selected.
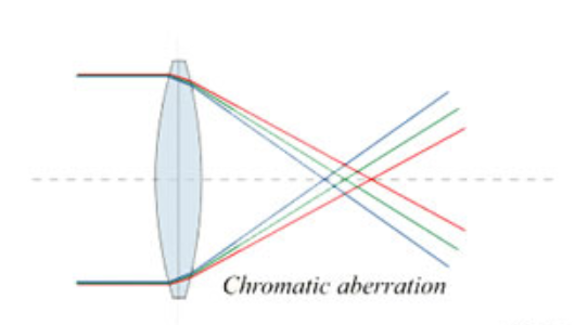
It is undesirable to form images using an electron beam containing multiple wavelengths because the (slightly) different wavelengths focus at (slightly) different positions. This results in the super-position of many images recorded with different defocus values and the resulting final image is blurred. Another way to think about this effect is in terms of the phenomenon called chromatic aberration: Lenses that focus white light actually focus each wavelength to a slightly different position (and high quality achromatic optical lenses can be designed to minimize this effect). It is exactly this same phenomenon that happens when an image is formed from electrons that have different wavelengths.
NOTE: It is not possible to make achromatic electro-magnetic lenses that would eliminate the chromatic aberration found in an electron microscope using an approach similar to achromatic optical lenses and it is currently necessary to use an energy filter instead.
The inner workings of an energy filter can be described with reference to several common manipulations of visible light discovered by Isaac Newton: A beam of white light can be separated into its different wavelengths (colors) using a glass prism. The separated colors can then be combined using a second prism to produce the original beam of white light. It is also possible to eliminate some of the colors in the original beam of white light by inserting a slit between these two prisms: the opening in the slit allows certain colors to pass through the second prism while the other colors are blocked by the solid parts of the slit.
In the energy filter of an electron microscope, both the size of the opening in the slit and its position can be varied, making it possible to produce a final image that is formed only from electrons containing very specific energies (wavelengths).
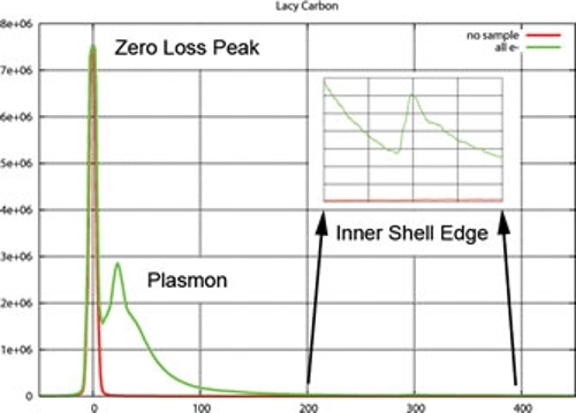
The case of "zero loss imaging" (i.e., forming an image using only those electrons that did not interact with the specimen or that have been elastically scattered while passing through the specimen) can be considered as a means of removing specimen-induced chromatic aberration from an otherwise perfect phase contrast image: multiple wavelengths arising from any and all inelastic scattering as the electron beam passes through the specimen are removed by the energy filter, producing an image formed from electrons with the same wavelength. The electrons that have not lost any energy are often referred to as the "zero loss peak" (ZLP) electrons. This application of EFTEM is commonly used when imaging frozen, hydrated specimens, where the amount of inelastic scattering due to the ice layer can be appreciable.
In addition, it is possible to form images using electrons that have lost the precise amount of energy caused by a specific inner shell ionization event. As described above, a specific energy loss is tied directly to a type of atom (and even further to atomic orbitals and the electronic state of that atom) and such images are often referred to as "elemental maps." For example, an image formed from electrons that have lost the amount of energy at the L2,3 edge of phosphorus can be used to locate high concentrations of P in frozen, hydrated bacterial cells (see Comolli, Kundmann & Downing, J. Microscopy 223, pp 40-52).
NOTE: In practice, inner shell ionization edges ride on top of an exponential falloff in energy loss due mainly to multiple scattering events. The signals at edges are most often smaller than this background signal and in order to correct for the background, up to three images using a narrow energy window located before and after the onset of the edge energy must be recorded. This increases the electron dose necessary for such analysis and can be a serious issue when working with radiation sensitive materials.
Images can also be formed using only those electrons that have been inelastically scattered but that have lost only a small amount of energy (a "plasmon image"). Plasmon images can be enormously useful for applications such as thickness mapping and for interpreting other information obtained using electron microscopy (where thickness can affect various signals).
Finally, for thick biological specimens, where the number of elastically scattered electrons is vanishingly small, one can record images using only those electrons with energy corresponding to the "most probable loss (MPL)" energy peak. The advantage of MPL imaging is that chromatic aberration is minimized since a narrow energy spread (compared to the unfiltered beam) is used for image formation.
For a thick specimen, the MPL peak is usually also the maximum peak from multiple scattering events and varies from specimen to specimen and even within a single specimen: The location of the MPL peak can change dramatically as thickness and composition change across the specimen. For true MPL imaging, an energy loss spectrum should be recorded before each image to ensure that the energy slit is placed in the proper location. MPL imaging is most related to plasmon imaging since even for a rather thick untilted specimen, the MPL peak generally falls within the accepted limits of the plasmon region (< 100 eV energy loss). However, as the specimen is tilted (or thicker regions examined), the MPL peak from the same specimen can shift to a loss of several hundred eV (and the number of elastically scattered electrons and the direct beam can vanish).
View examples of EFTEM images recorded using our JEOL JEM 3200FS