

A non-rigorous description of the Nyquist frequency or the Nyquist limit (named after the engineer Harry Nyquist) is simply that it is half the sampling rate of a "signal" (UV-visible light spectrum, audio file, image, whatever) that is discretely sampled. This comes out of the field of information theory which was developed by the engineer/mathematician Claude Shannon and is a concept that should be familiar to everyone who uses digital images.
An Oddity of the Nyquist Limit in N Dimensions
In the cryoEM community, the term Nyquist limit is sometimes replaced by "Shannon sampling limit" and is rather casually referred to as the resolution limit of an image that is imposed by the pixel size of the digitization process (e.g., the film scanner or CCD camera). As noted above, the Nyquist frequency is half the sampling rate, which translates into the reciprocal of twice the pixel size of a digitized image. It is always important to note that this is often not the useful resolution limit of the image (which might be limited by factors such as staining, defocus or the environment of the microscope), but rather reflects the highest theoretical resolution that can be attained given the discrete sampling of the image.
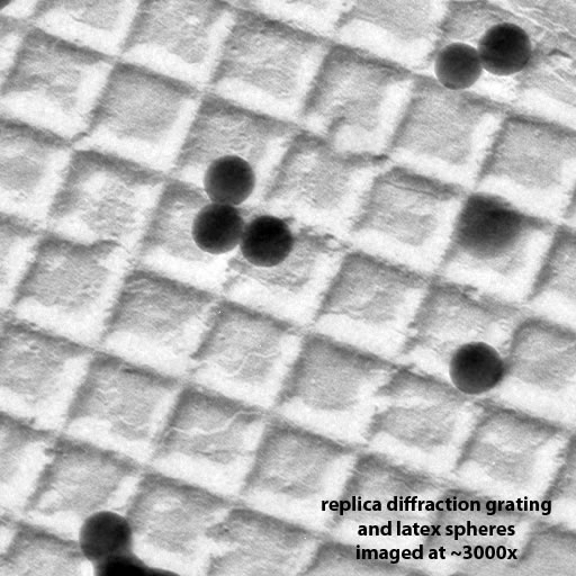
In practical terms, when examining the discrete Fourier transform of a digital image, the horizontal and vertical edges of the transform directly reflect the Nyquist frequency. For example, the image shown to the right is a 512 x 512 pixel image from a larger image recorded with the Gatan UltraScan 4000 CCD camera on our JEOL JEM 3200FS. The diffraction grating should have a spacing of 463 nm. The sampling in this image was calculated to be 5.6 nm/pixel (based on the distance between lines in the replica diffraction grating or the frequency of the diffraction maxima from the replica grating which are seen in the Fourier transform below). The Nyquist frequency (limit) of this image is the reciprocal of twice the pixel size or 1/11.2 nm (0.0893 nm-1).
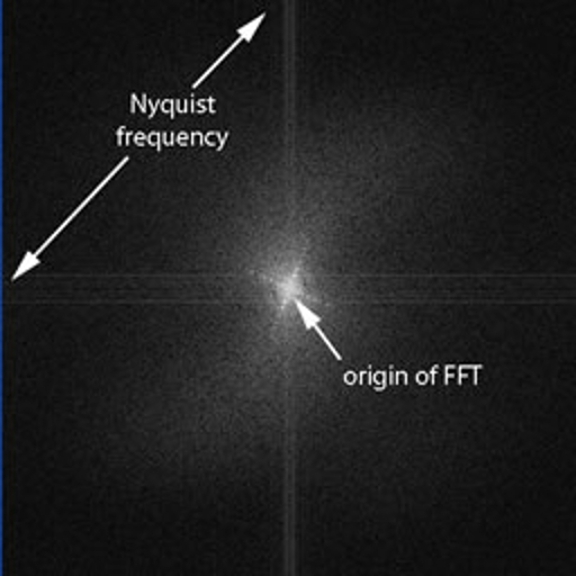
The arrows here indicate the Nyquist frequency and point to the edges of the Fourier transform that are above and to the left of the origin of the Fourier transform. To be more correct, these arrows should point to the one pixel along the edge of the Fourier transform that is exactly above the origin and to the one pixel along the edge of the Fourier transform that is exactly to the left of the origin (or to the edge pixels below and to the right of the origin that are related to these according to Friedel's law).
There is clearly very little information outside the central region of this Fourier transform. This is a consequence of the low resolution nature of this image, and is a property of the "contents" of the image (i.e., what is shown in the image) but not of the digital nature (discrete sampling) of the image. For example, if the replica diffraction grating had been better defined (more regular, sharper edges), the diffraction from it would have extended further towards the edge of the transform (towards higher resolution).
The frequency (or resolution) measured in Fourier transforms is a function of the distance from the origin of the Fourier transform (located in the center of all the transforms shown here) and longer distances correspond to higher frequencies (higher resolutions, smaller spacings in the original image). In the last image/Fourier transform pair, the single diffraction maximum in the Fourier transform occurs at a radial position that is sqrt(2) times the distance from the origin to the edge of the Fourier transform in either the horizontal or vertical directions (i.e., the distance that defines the Nyquist frequency or limit). This long distance (and the corresponding high resolution) is clearly larger than the Nyquist limit (and thus higher resolution than the Nyquist frequency allows) but also clearly corresponds to a real feature of the Fourier transform: if the maxima at this distance are removed from the Fourier transform and a back-transform is calculated, the resulting image is featureless. As a matter of fact, every Fourier transform based on the checkerboard images above contains some diffraction maxima that are further from the origin than the distance measuring the nominal x/y Nyquist limit.
How is this seeming contradiction explained? There are at least two different ways to think about it:
- One way is simply to say that there is sampling in the image in both the x and y directions, and that, for example, the diffraction maximum in the corner of the last Fourier transform sits at the Nyquist limit in the x-direction (x-dimension or first dimension) and simultaneously at the Nyquist limit in the y-direction ( y-dimension or second dimension). A way to think about this is that the Nyquist limit is defined only in the sampling direction(s): as long as a feature like this diffraction maximum does not exceed the Nyquist limit in the x- or y-directions, there is no contradiction.
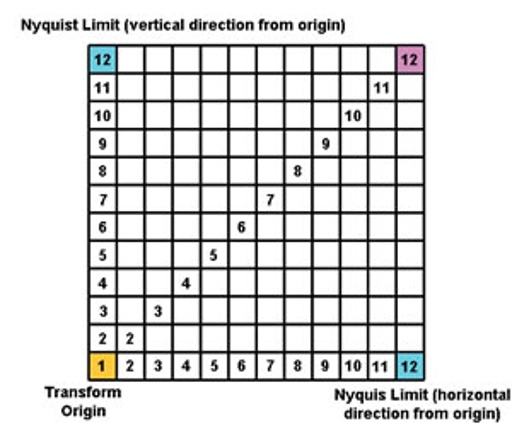
There are diffraction maxima in the other Fourier transforms shown above that sit at radial distances beyond the nominal Nyquist limit, but that are still within the Nyquist limit in either x or y (and thus do not present a contradiction when using this formalism). An advantage of this particular formalism is that it extends to any number of dimensions easily and it allows for unequal sampling in any of the dimensions. On the other hand, the implication of this is that in a two- (or higher) dimensional data set, the idea of resolution expressed using radial geometry from the Fourier transform origin is incorrect (and that is both counter-intuitive and unsatisfactory in some sense). - Another way to think about this is to count the sampling points along the lines that run from the origin of the Fourier transform to the horizontal and vertical edges, and to the corner. That is difficult to do in the images shown above, but the illustration at the right (a 12 x 12 grid of squares) shows this in cartoon form. In this cartoon, although the geometric distance between the gold colored square (the Fourier transform origin) and the three other corners (two cyan and one magenta) differs, the number of steps (sampling points) between them is the same.
This formalism indicates that every grid square in the Fourier transform is fewer steps (sampling points) from the origin than the three corners (and thus every point within the transform is within the Nyquist limit). This is perhaps unsatisfactory in the sense that most of the grid locations cannot be reached by a straight line of sampling steps, but it remains true that the minimum number of sampling points to any place within the grid will be less than the minimum number to the Nyquist limit.
However one choses to think about this, bear in mind that:
- Shannon sampling is the correct way to think about and treat discretely sampled data;
- the Nyquist limit is an absolutely true property related to Shannon sampling;
- every point in a Fourier transform is within the Nyquist limit based on the sampling of the original image.
One implication of this is that if the data in a Fourier transform are filtered using any sort of mask with a radial limit, real information is (potentially) being discarded. This happens when (for example) a three-dimensional cryoEM reconstruction is blindly filtered "to the Nyquist limit" (i.e., to the radial limit defined by 1/(2 * step size)). In most cases, there is little to no real information at these resolutions. However, one should always keep in mind that there is the possibility of information in these locations, and one should at least understand one's data as well as possible.
View our series of images showing information captured outside of the Nyquist Limit
These images displaying information beyond the Nyquist limit were recorded on the JEOL JEM 3200FS using either our Gatan UltraScan 4000 CCD camera or a demo Direct Electron DE-12 camera show that there can be real information that would be lost if an image were to be blindly filtered to the Nyquist limit.